Dynamic SBOM with Mayhem
Use Mayhem to filter down SCA and SBOM results, so you can focus on what's actionable.
Mayhem Dynamic SBOM augments SBOM and SCA tooling with dynamic results obtained from observing actual behavior of containerized applications.
By collecting and indexing data about which components are used at runtime vs merely statically present in an OCI image, we can provide greater insight into the impact of reported vulnerabilities than possible through static SCA alone.
How does it work?
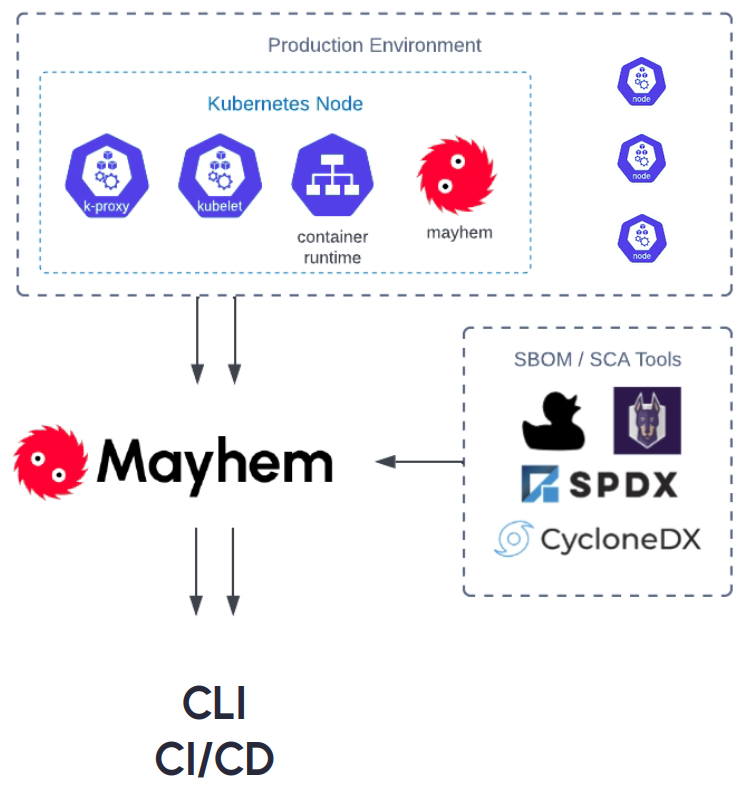
At a high level, we deploy an observability service on a host which lives next to the container engine (Docker, Podman, etc.) running your application. This observability service leverages our dynamic analysis technology to observe and record metadata about the runtime behavior of the containers running on a configured host. Notably, this service runs in userland only, and does not require interfacing with custom kernel modules or code changes to your application in order to function.
With this historical data preserved and indexed, we can then ingest SBOM/SCA reports generated by other tools (or using one of our preconfigured integrations) and augment their findings with evidence from our database.

Where does it live?
As mentioned, we run an observability service on hosts in your infrastructure, next to a container engine such as Docker or Podman. This service maintains a log of behaviors observed in the containers running on a given host.
Our analysis is meant to augment existing SBOM/SCA tooling in your development process, so therefore we can be run after a static SBOM/SCA tool has been run in order to correlate its findings with our observations of application behavior. Wherever SBOM/SCA tooling exists in your workflow today, we fit in right after.
Please see our section on deployment for more details.
What do I do with the results?
Our tool uses the runtime behavior of your application to prioritize results from static SBOM/SCA tooling. We therefore expect a SBOM/SCA report in a standard format generated from your existing tooling as input, and produce an annotated report with output containing a summary of our runtime observations relevant to each source finding.
This report contains additional information regarding if a vulnerable component was observed in use at runtime, and where this usage occurred. This information can be used to prioritize findings, jump start a manual investigation into the impact of a vulnerability, inform patching strategies, and more.
Please see our section on results for more details.
Sounds great! Where do I start?
Please proceed to our installation section, then on to our quickstart guide!