バグのあるエンドポイントの識別
Mayhem は問題が見つかると、問題を発生させた入力値とともにレポートします。このセクションでは、Mayhem が発見した問題を参照するさまざまな方法を説明します。
Web UI
Mayhem は API テストで見つかった問題を ForAllSecure のクラウド サービスにアップロードします。https://app.mayhem.security で UI にサイン インすると、各ランの詳細を調べることができます。これには、見つかった各問題の詳細とともに、エンドポイントごとのレスポンス コードの分布や遅延時間のパーセンタイル値などの統計値が含まれます。次の図は UI の外観の例です。
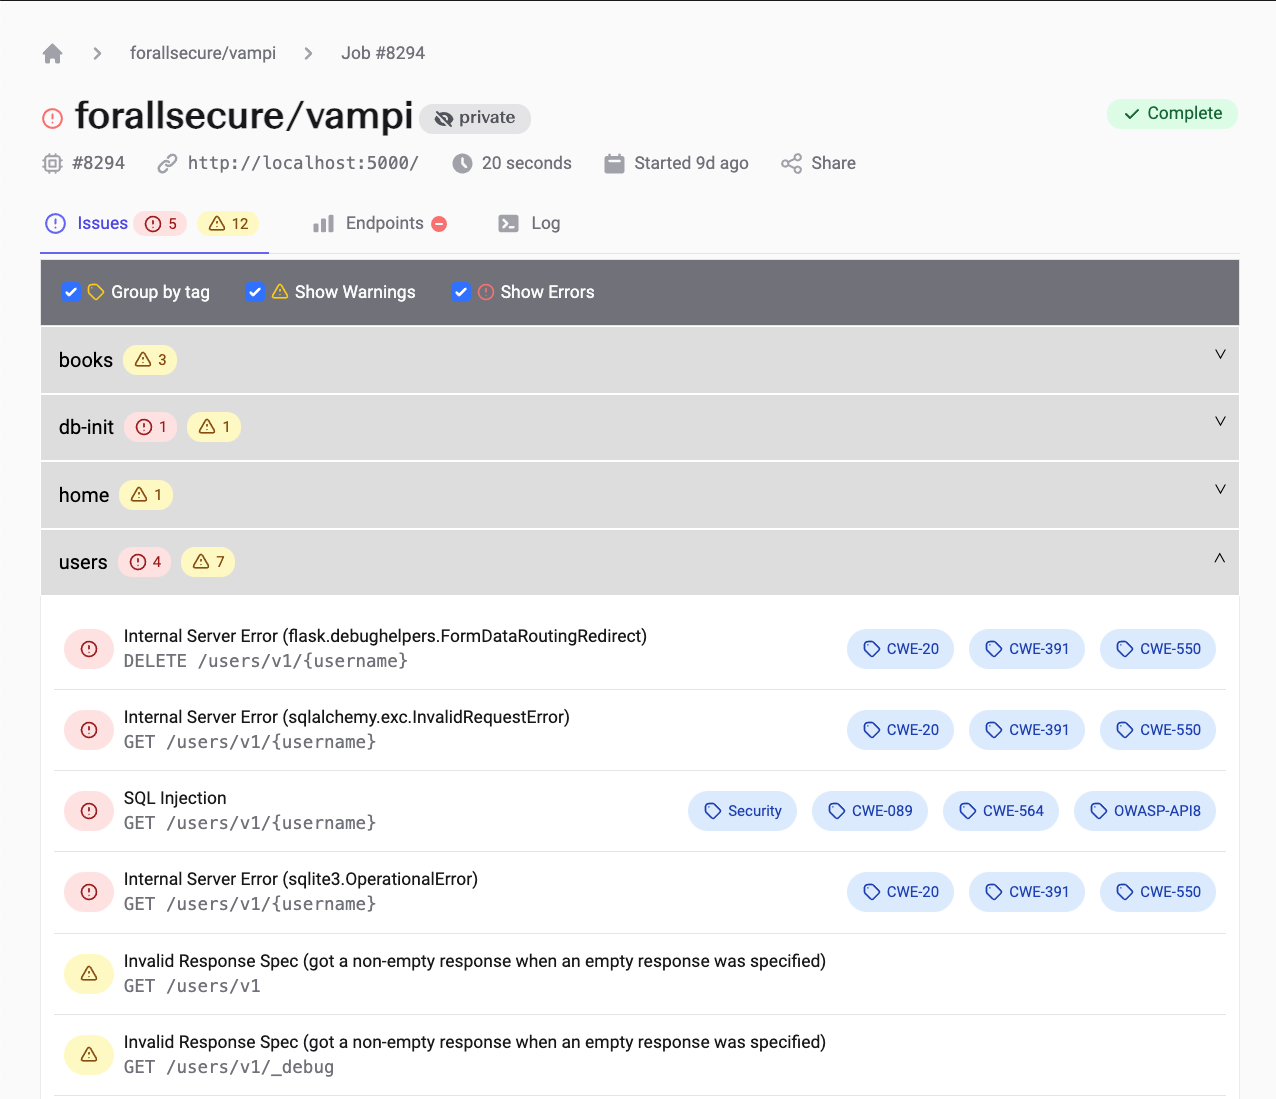
Web UI の詳細レポート
HTML レポート
mapi run に --html 引数を指定することで、Mayhem は静的なローカル HTML レポートを生成できます。HTML レポートには、対応する Web UI と実質的に同じ情報が含まれます。 レポートは CI システムで「ビルド成果物」として保存できます。次の図は HTML レポートの外観の例です。
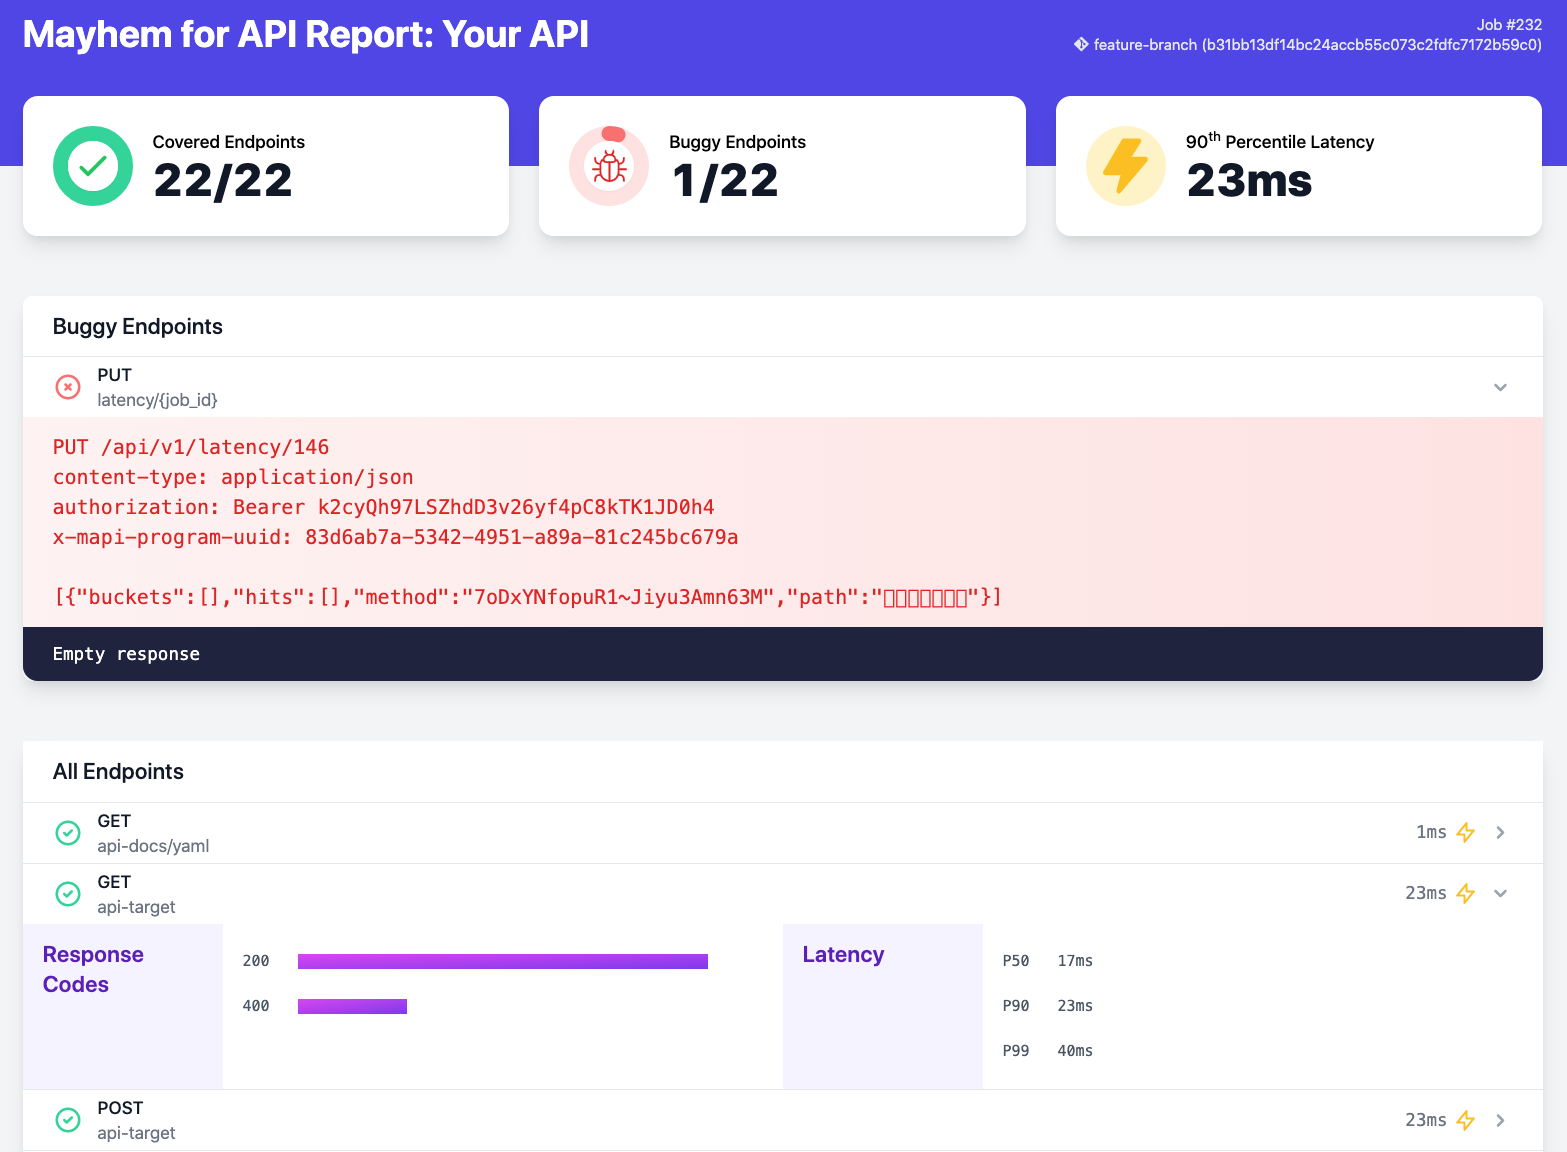
詳細な静的 HTML レポート
JUnit レポート
mapi run に --junit 引数を指定することで、Mayhem は CI フレンドリーで業界標準の JUnit レポートを生成できます。JUnit レポートには、見つかった問題の詳細がすべて含まれますが、Web や HTML レポートのような追加の統計値は含まれません。レポートは、ほとんどの CI ソフトウェアで取り込みとネイティブな描画が可能な機械処理可能なフォームで生成されます。
デフォルトでは、JUnit レポートにはエラー レベルの重要度を持つ問題だけが含まれます。警告レベルの問題もレポートに含めるには、mapi run ... --warnaserror --junit <test-output.xml> の呼び出し時に --warnaserror フラグを指定する必要があります。
SARIF レポート
mapi run に --sarif 引数を指定することで、Mayhem は SARIF ファイルも生成できます。GitHub を使用しているのであれば、SARIF ファイルは GitHub に課題をアップロードするのによい方法です。詳細については「GitHub との統合」セクションを参照してください。
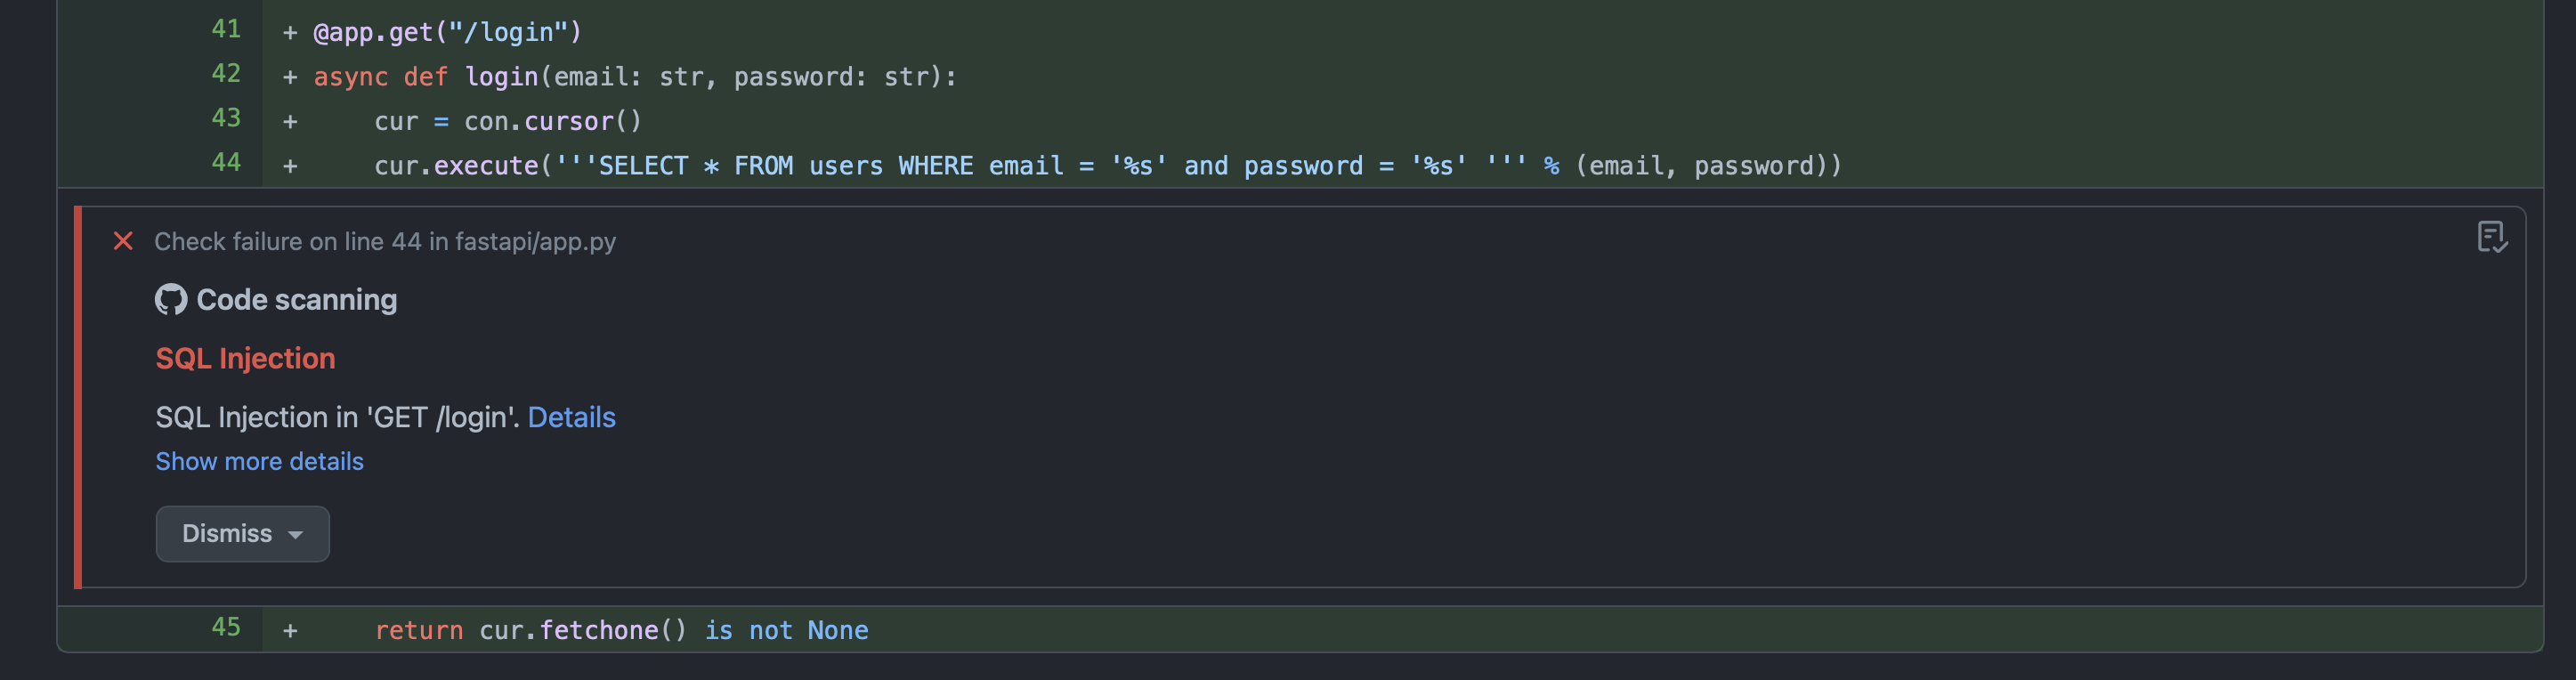
GitHub での Mayhem API testing の問題の表示
Microsoft の提供する SARIF 拡張を使用すると、VSCode に SARIF ファイルをロードすることもできます。
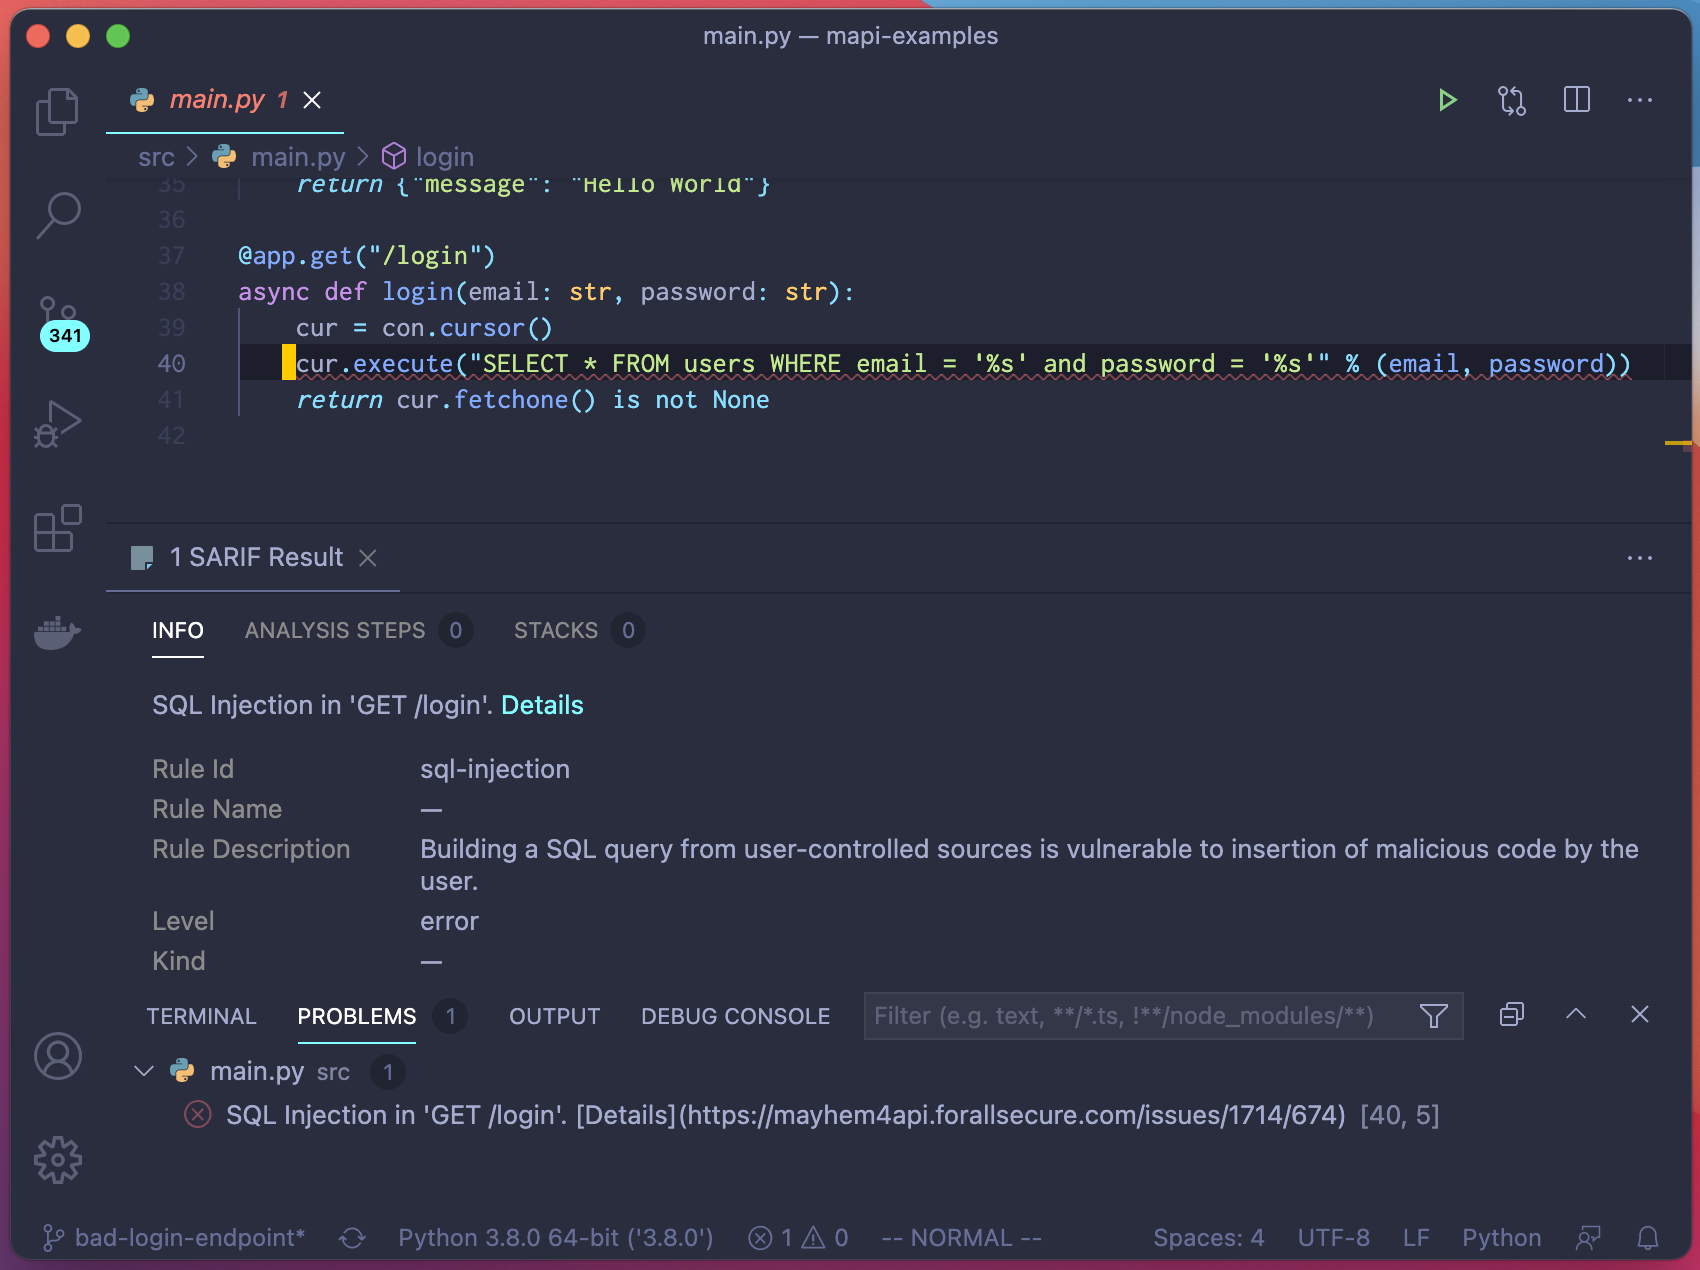
VSCode での Mayhem API testing の問題の表示
Info
Mayhem が各問題に正確なファイルおよび行の情報を付加するには、API が "500 Internal Server Error" レスポンスのボディにスタックトレースを含める必要があります。この設定は開発およびテスト環境でだけ使用します。運用環境では絶対に使用してはいけません。
ツールのデバッグ
もちろん、何らかの方法で Mayhem に問題を発見させるのは、開始点にすぎません。問題を分離し、再現し、最終的に修正するのは大変な作業です。
以下は、作業を容易にする可能性があるアプローチの例です。(これらのアプローチは、Mayhem とはまったく独立しています)
API ログ
コード 500 エラーが発生したとき、最も単純な解決策は API ログを通して調査することです。ログには、問題を発生させたコード行を特定するスタック トレースが含まれていることがよくあります。ElasticSearch または Splunk などを備えた中央化されたログ記録システムがある場合、おそらくレスポンス コードでログをフィルタリングしてコード 500 のレスポンスだけを表示できるでしょう。
ファザーによって生成されたリクエストには次のヘッダーが含まれます。それらのヘッダーは、ログを通して調査し、ログ イベントと特定のファジング入力値を関連付けるのに役立ちます。
User-agent: mapi/X.X.XX.X.Xは mapi CLI バージョンを表します。X-Mapi-Program-UUID: <UUID>UUIDはファジング入力値に対応します。このヘッダーを使用すると、mapi レポートのバグのあるリクエストと API ログを関連付けることができます。
エラー モニタリング ツール
API にエラー モニタリング ツールをインストールするのは、バグを深く調査する最善の方法であると考えられます。エラー モニタリング ツールは、実行中の API だけでなく、他のマイクロサービスやバックグラウンド ワーカーなどの他のバックエンド システムもモニターできます。そういったバックエンド システムは、API が 500 レスポンスを返すことなくエラーを発生させることがありますが、エラー モニタリング ツールは、そのような発生してもファザーでは検出されない問題を検出できます。
エラー モニタリング ツールはエラーを検出し、できるだけ多くのコンテキストを収集し、類似したエラーをグループにまとめ、次の sentry.io の例のような UI を通じて提示します。
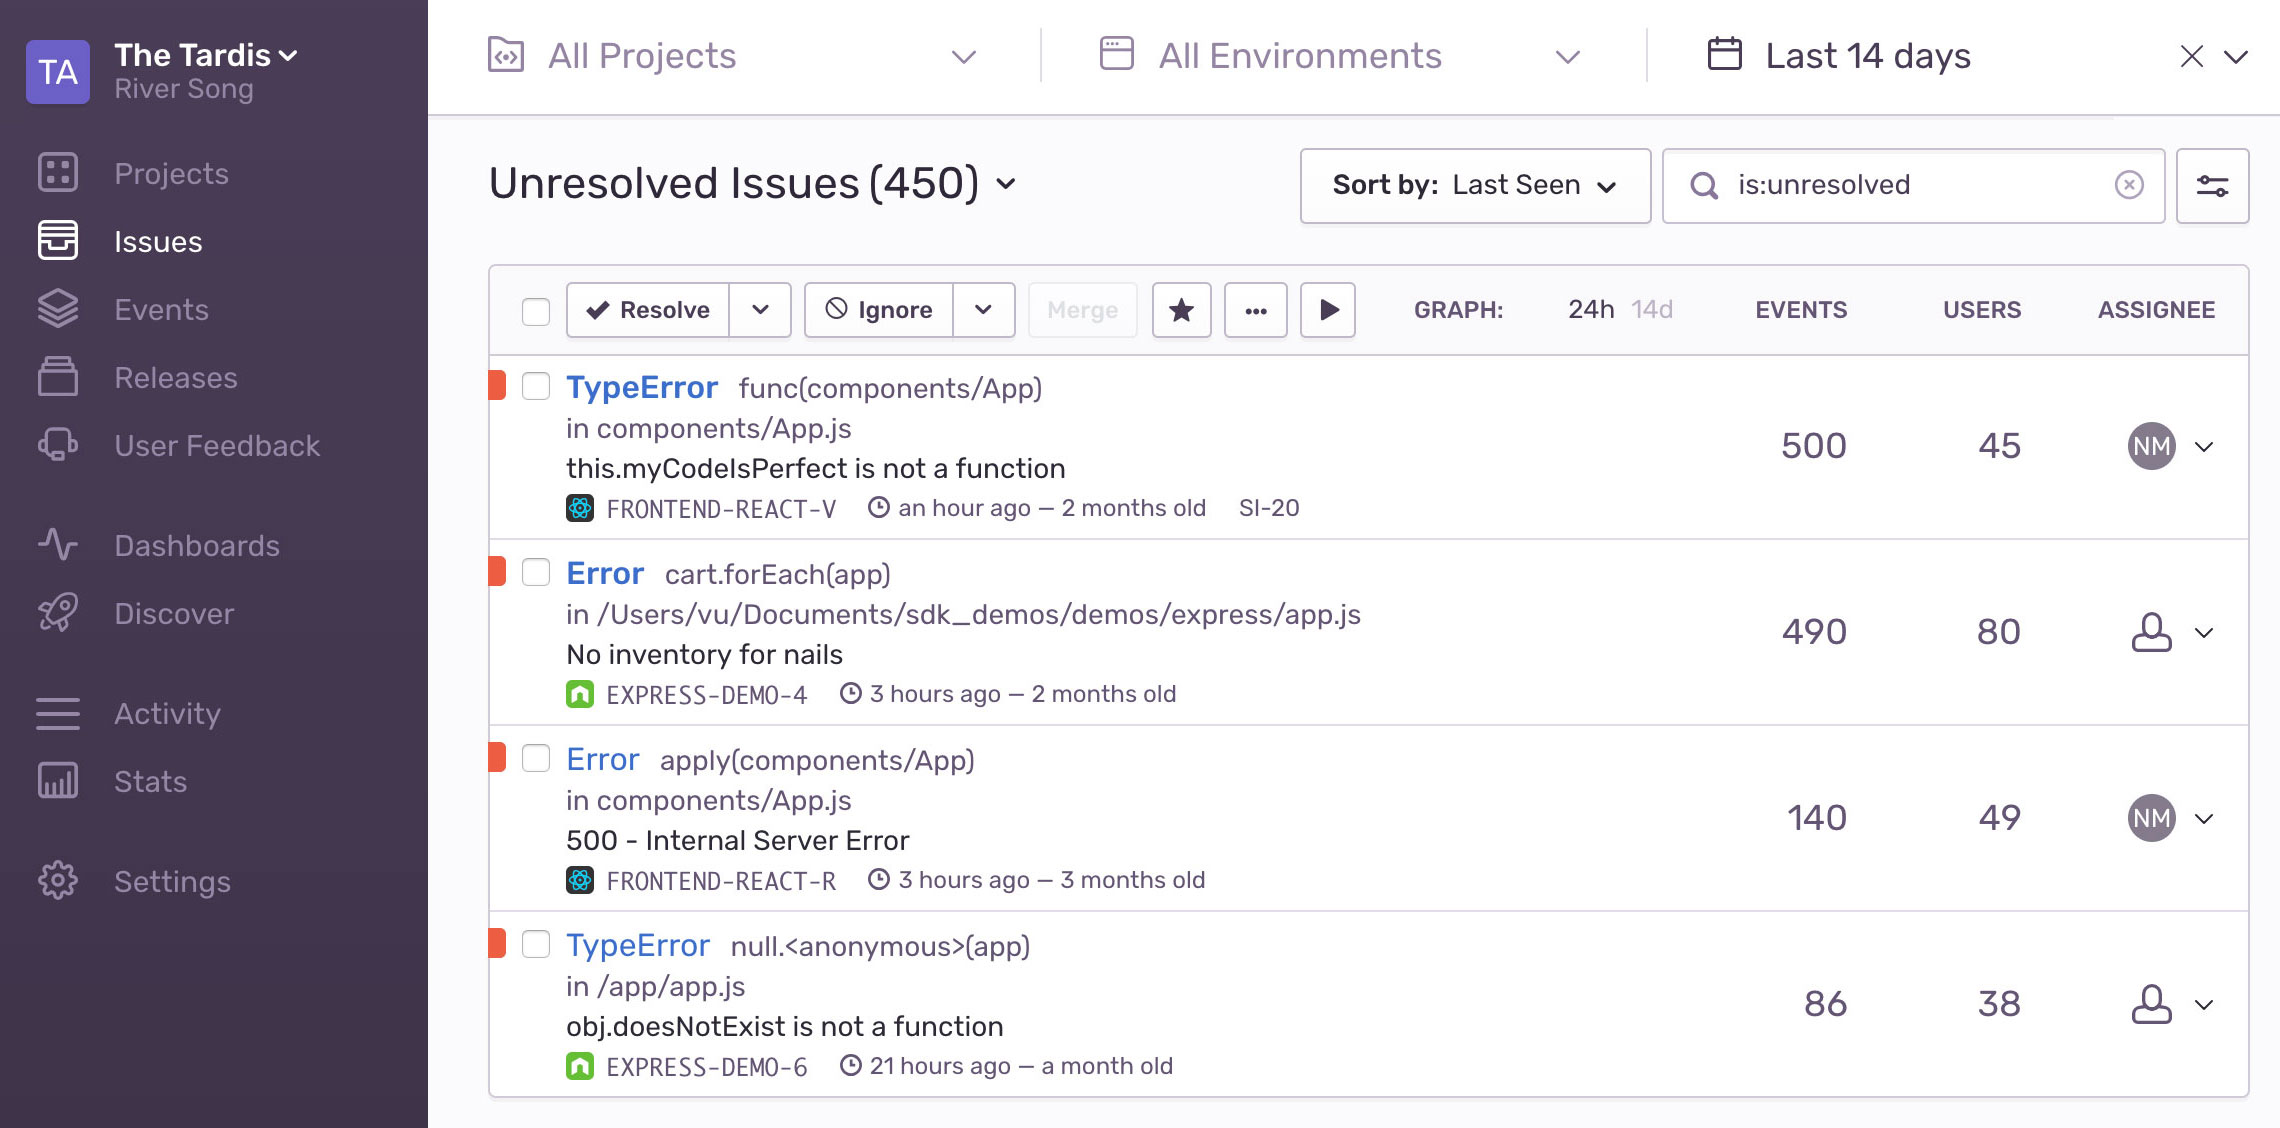
多数のサードパーティが有用なエラー モニタリング ツールを提供しています。
すでに運用環境でこのようなツールが使用されている可能性は高いでしょう。ツールをファジングに活用すると、ファザーが発生させたバグについて深い洞察を取得できます。ファザーが問題を発見すると、エラー モニタリング ツールが警告を発します。エラー モニタリング ツールは、スタック トレースなど、問題の把握に役立つ豊富なコンテキスト情報を提示します。場合によっては、バグが運用環境に入り込む前に問題の警告を受け取れることもあるでしょう。